Case study
Portal — a geospatial data-delivery platform
A secure, serverless web platform that lets engineering teams open and share 500 GB survey datasets from a browser. Sole architect and developer. Live at site-portal.co.uk.
ProblemWhat I builtArchitectureProcessing pipelineDecisions & trade-offsAt 100×Results
The problem
Drone and LiDAR surveys of large industrial assets produce datasets of 500 GB and more: 3D point clouds, 360° imagery, orthophotos. Clients' machines couldn't open them. Data was moving around engineering teams on hard drives, which was slow, insecure and didn't scale past a handful of users.
I was on the survey side when I saw this, which is why the fix started as a one-client workaround and not a product roadmap.
What I built
A web platform where clients view and distribute massive geospatial datasets straight from the browser: interactive 3D point clouds, 360° panoramas, orthophotos, asset and pipeline overlays, and live drone streaming.
I owned the whole thing: product discovery with clients, architecture, frontend, backend, cloud infrastructure, data pipelines and deployment. Features shipped on direct client feedback include a confined-space drone trajectory visualiser, bespoke asset/pipeline mapping, and the admin and distribution tooling that lets a project lead hand a dataset to 200 engineers in a minute.
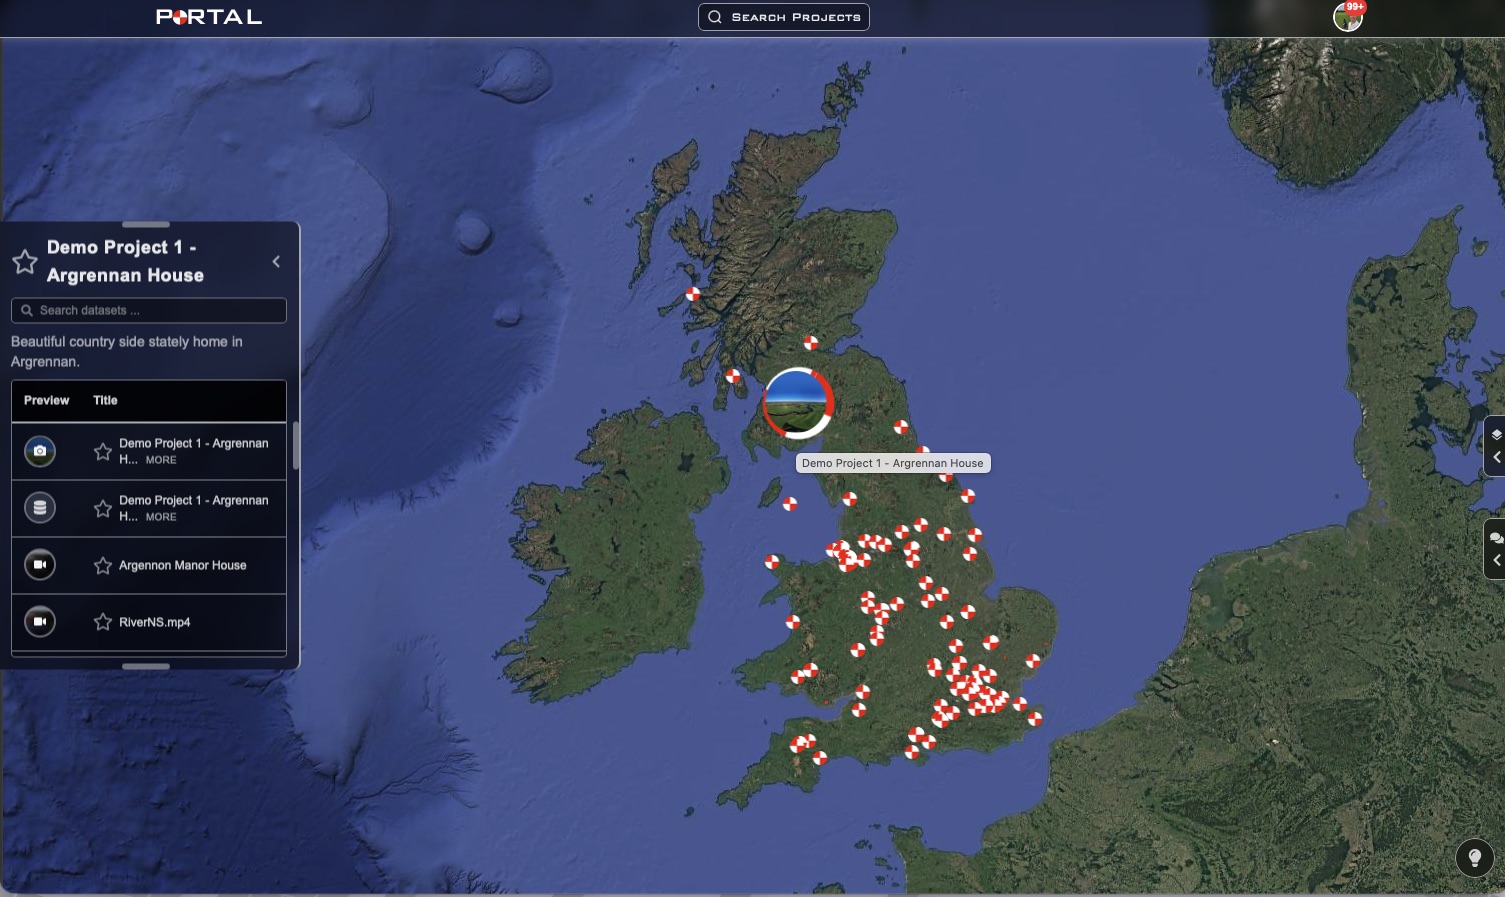
How it evolved
Three versions in four years. Each one was built alongside the live one and swapped over with clients in production. Each rewrite was forced by a constraint, not a wish list.
June 2022 — v1: from hard drives to a link
An oil & gas client in southern Iraq needed a full suite of drone-inspection data. The options were shipping hard drives or putting it online. I taught myself web development and built the first Portal: a map of assets, each opening a photo tour.
January 2023 — v2: React, and three years of compounding
Rewritten in React for reusable components, so each new feature cost less than the last. It grew in steps: point clouds, KML datasets, and an admin console. I had been spending an hour a day in the database adding users and projects. Today, client organisations manage their own users and our surveyors create projects themselves.
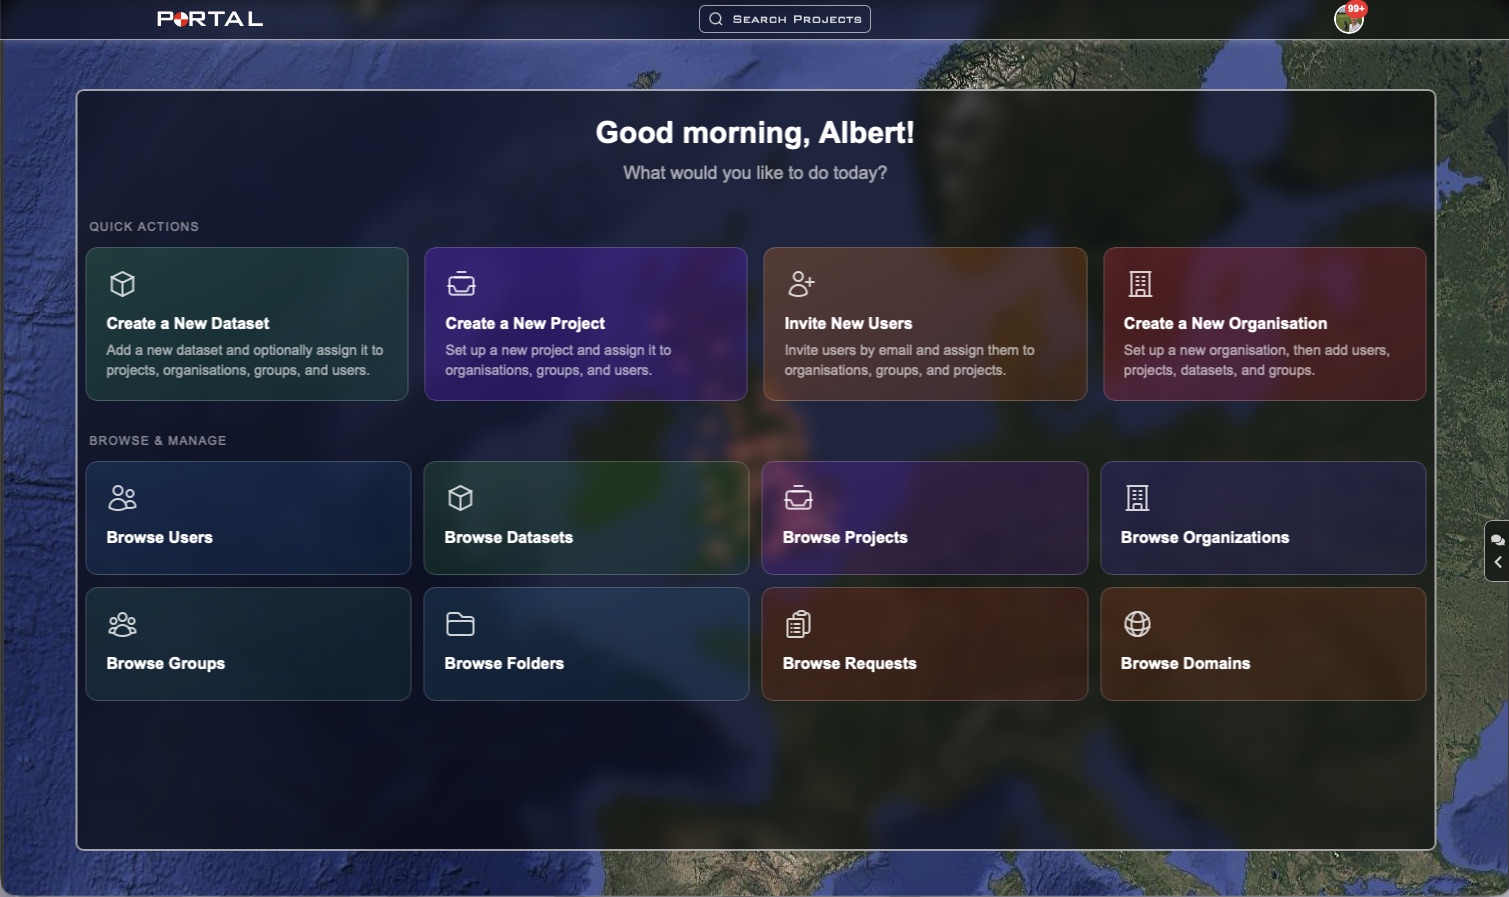
May 2026 — v3: Next.js
Two constraints forced the rewrite. First, a self-managed Node server on EC2: patching, runtime and keys were all on one person. Second, a single-page app that loaded every heavy viewer before showing anything. Moving to Next.js on AWS Amplify removed the server. With route-level code splitting, each page ships only what it needs, and the point-cloud viewer loads only when it is used.
v3 was built with a spec-driven, AI-assisted workflow that I direct and review: architecture and specs first, generated code second, my own tests and review last. It also added in-platform chat, groups, email and in-app notifications, video, and direct web upload.
A viewer built for the job
The off-the-shelf point-cloud viewer was built to own the page and couldn't live inside the app, so I built one. It has saved views, collaboration files, and each survey photo shown as an oriented frame at the exact spot it was taken.
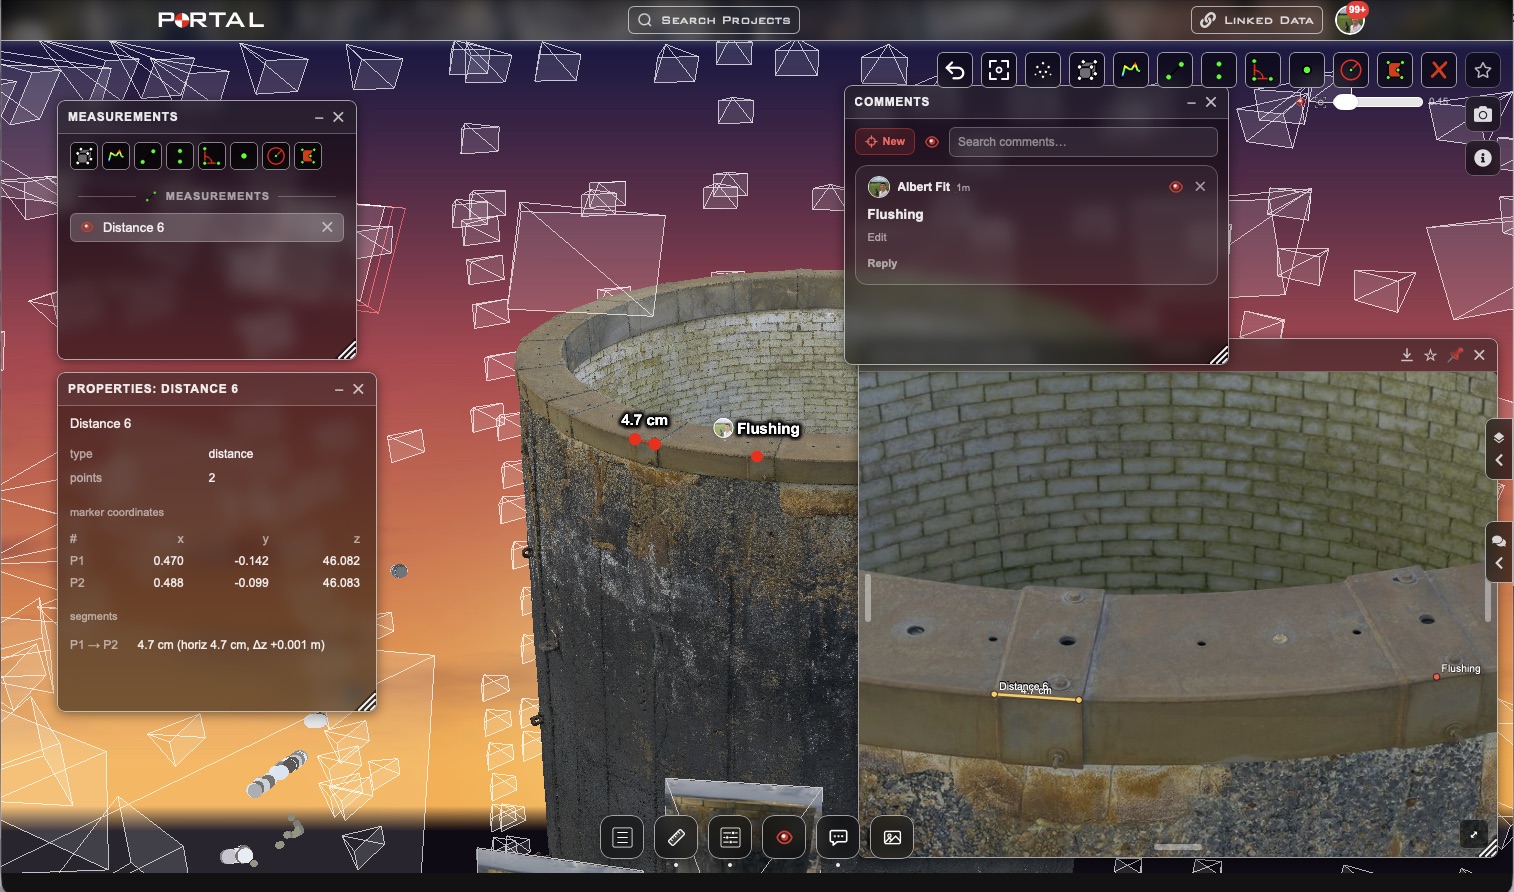
Architecture
- Full-stack: Next.js (JavaScript): server and client in one framework, with in-browser 3D point-cloud and 360° viewers.
- Data: MongoDB. The schema was re-designed mid-life (migration written against the Python driver) to remove anti-patterns and speed up queries on large object lists.
- Hosting: AWS Amplify with CloudFront distributions in front; S3 for the heavy assets, with automated lifecycle tiering to cold storage.
- Delivery: continuous deployment on AWS Amplify (dev and prod environments, deploy on push), Playwright end-to-end tests run before every push, AI-augmented development, short sprints driven by direct client feedback.
The processing pipeline
Photogrammetry is two very different workloads. Image alignment is memory-bound; dense reconstruction is GPU-bound. Running both on one big machine means paying for a GPU while it idles through alignment.
I wrapped the Reality Scan (formerly RealityCapture) CLI in a Windows-Docker container and split the job across AWS compute tiers: a memory-optimised instance for alignment, a GPU instance for reconstruction, with S3 as the hand-off between stages. It runs as burst capacity: when a job outgrows the three on-premise workstations, the overflow goes to the cloud. It carried a £300k project the in-house machines could not, and sits dormant between jobs, redeployable on demand.
Decisions & trade-offs
One framework for server and client
Next.js let one person ship a full product: API routes for the backend, React for the viewers, one deploy. The cost is that heavy viewer code and server logic live in the same repo and the same build. For a solo-built product serving thousands of users that was the right trade; it's the first thing I'd split if the team grew.
MongoDB, and then re-designing the schema
The first schema grew with the product and embedded large arrays inside project documents. It was fine at ten projects and slow at hundreds. The re-design moved high-cardinality collections out of the parent document and indexed what the list views actually query. Lesson banked: model for the read patterns you have, not the ones that were convenient in week one.
Amplify + CloudFront rather than hand-rolled infrastructure
Managed hosting and a CDN bought me deploys, TLS and edge caching for near-zero operational time. The trade-off is less control over the server runtime; so far that has never been the bottleneck, the asset delivery has.
S3 lifecycle tiering
Survey data is hot for weeks and then archival for years. Lifecycle rules that transition objects to cold storage after the hot window cut storage spend by roughly £3,500 a month with no code change and no user-visible impact. Retrieval latency on cold data is the accepted cost.
Security posture
Emailed one-time-code login, project-scoped access, audit logging on the cloud account, MFA on every console user. Enough for oil & gas and government-estate clients to write the platform into their contracts.
What breaks at 100×
Honest answer: not the web tier. CloudFront and a serverless Next.js deployment absorb 100× the page views without redesign. The things that break are:
- The processing pipeline. Today it's a small number of long-running jobs on a small number of instances. At 100× it needs a proper queue, autoscaled worker pools per stage, retry and dead-letter handling, and cost caps, because GPU hours are the dominant cost line.
- Upload ingestion. 100× the survey uploads means multipart, resumable uploads straight to S3 with server-side validation, not anything that passes through the app.
- MongoDB read patterns. The list views would need pagination with cursors and a read-replica, and the largest collections would need sharding keys chosen around project ID.
- Egress. Point-cloud streaming is bandwidth-heavy; at scale, tiled/LOD formats (the COPC/3D Tiles family) and tighter CDN caching matter more than any server change.
Results
| Outcome | Impact |
|---|---|
| Platform adoption | 6,000+ engineers; written into client contracts as a delivery requirement |
| Project scale supported | £5bn+ of infrastructure: a UK parliamentary estate, two major oil refineries, oil & gas fields in southern Iraq |
| Commercial impact | Revenue unlocked tripled the survey team and multiplied company EBITDA |
| Orthophoto automation | Removed ~20 hrs/week of manual work from the technical director |
| Survey-pipeline automation | Saved ~56 engineer-hours/week (part of ~145 hrs/week across the team) |
| Cloud cost | Cut ~£3,500/month via S3 lifecycle tiering |
| £300k project delivered | Cloud overflow pipeline when on-premise capacity ran out |
Screenshots of the point-cloud viewer, 360° viewer and asset map to follow (client data removed).